 |
||||||||
Page 1 ........ Page 2 ........ Page 3 ........ Page 4 ........ Figure1 ........ Figure2 ........ Figure3 ........ Figure4 ........ Figure5 ........ Next Figure
An Integrative Neuroscience Program Linking Mouse Genes to Cognition and Disease
Figure4. Schematic representation of Layer 3.
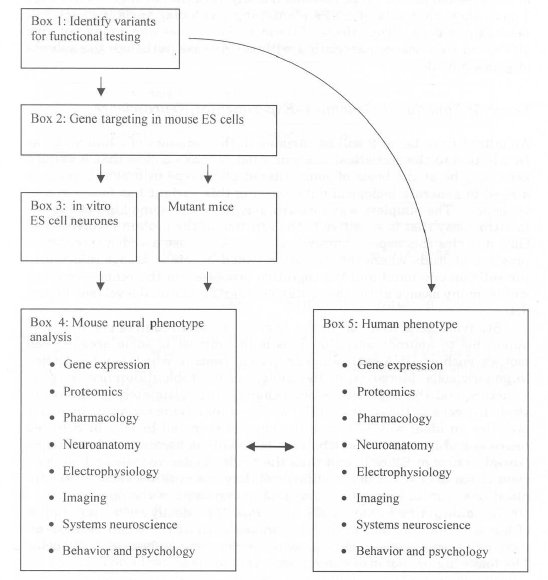
Layer 3 shows a simplified flowchart beginning with the sequence of putative human variant gene and an outline of assays based on mouse embryonic stem (ES) cell technology. These ES cell experiments are based on generating mutant cell lines that can be used to generate mutant mice (Box 4) as well as in vitro differentiation into neurons (Box 3; see Figure5 for more detail). A list of phenotypes that can be scored are shown in Box 4 for mice, and a comparable set of human phenotype data can also be drawn from the profiling of the subjects used for the DNA used in Layer 2. The arrow from Box 1 to Box 5 is meant to indicate that the human phenotypes listed are those relevant to the DNAs that were used in the genotype screen.