 Optical Flow
Data
Optical Flow
Data
Optical Flow
Data
Optical Flow
Data
Data for the real scene
These are the smoothed flow sequences for the Waverly train station scene. There are 4 files number (002) is used for testing the remaining used for training. Use from frame 500 to 5500.
test: station_002.zip training: station_003.zip station_004.zip station_005.zip
Data for the simulated scene
These are the smoothed flow sequences for the train station simulation. There are 30 files divided in the groups below. Use from frame 1100 to 4000. The emergency is at frame 2000.
Group 1: Normal - Training
normal_1.zip normal_2.zip normal_3.zip normal_4.zip normal_5.zip normal_6.zip normal_7.zip normal_8.zip normal_9.zip normal_10.zipGroup 2: Normal - Testing
normal_11.zip normal_12.zip normal_13.zip normal_14.zip normal_15.zip normal_16.zip normal_17.zip normal_18.zip normal_19.zip normal_20.zipGroup 3: Emergency - Blocked exit at the bottom of the scene.
block_1.zip block_2.zip block_3.zip block_4.zip block_5.zip block_6.zip block_7.zip block_8.zip block_9.zip block_10.zip
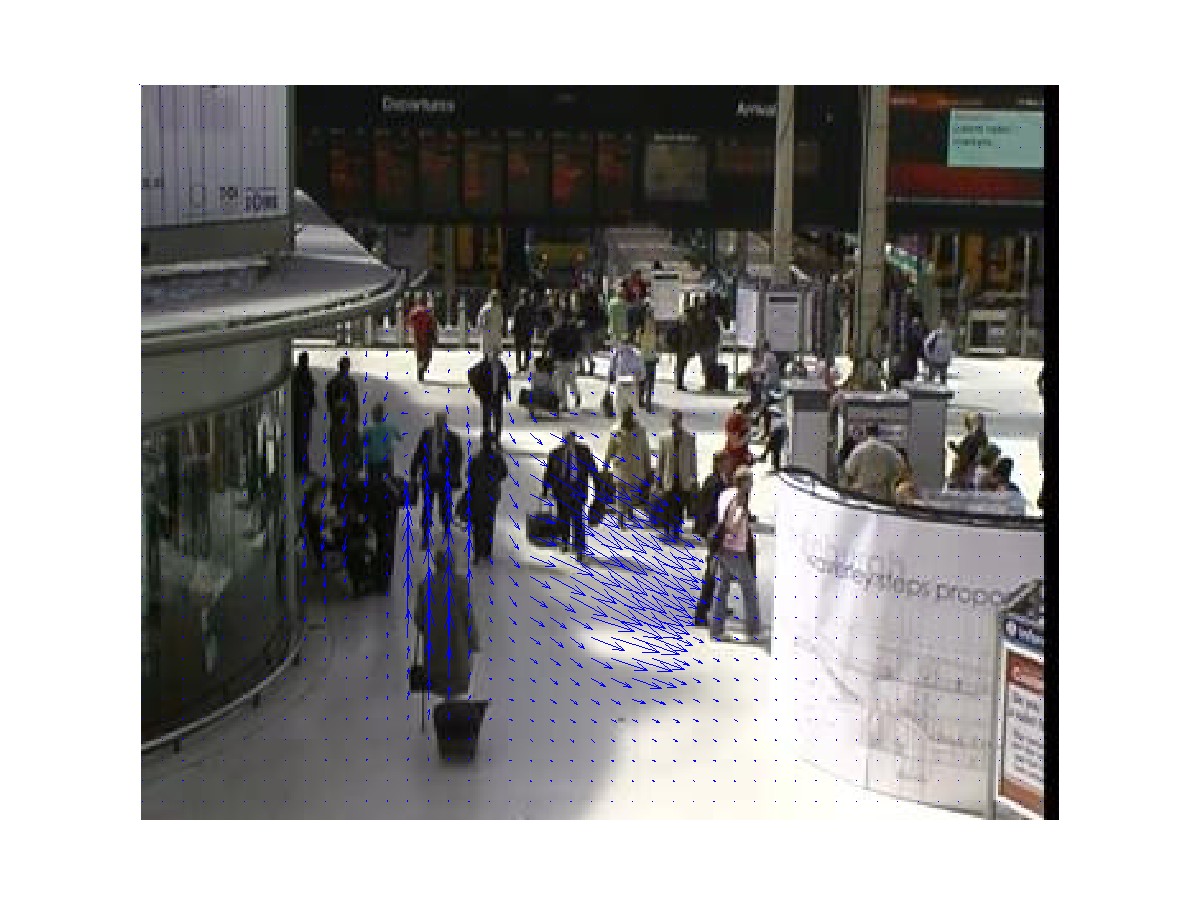
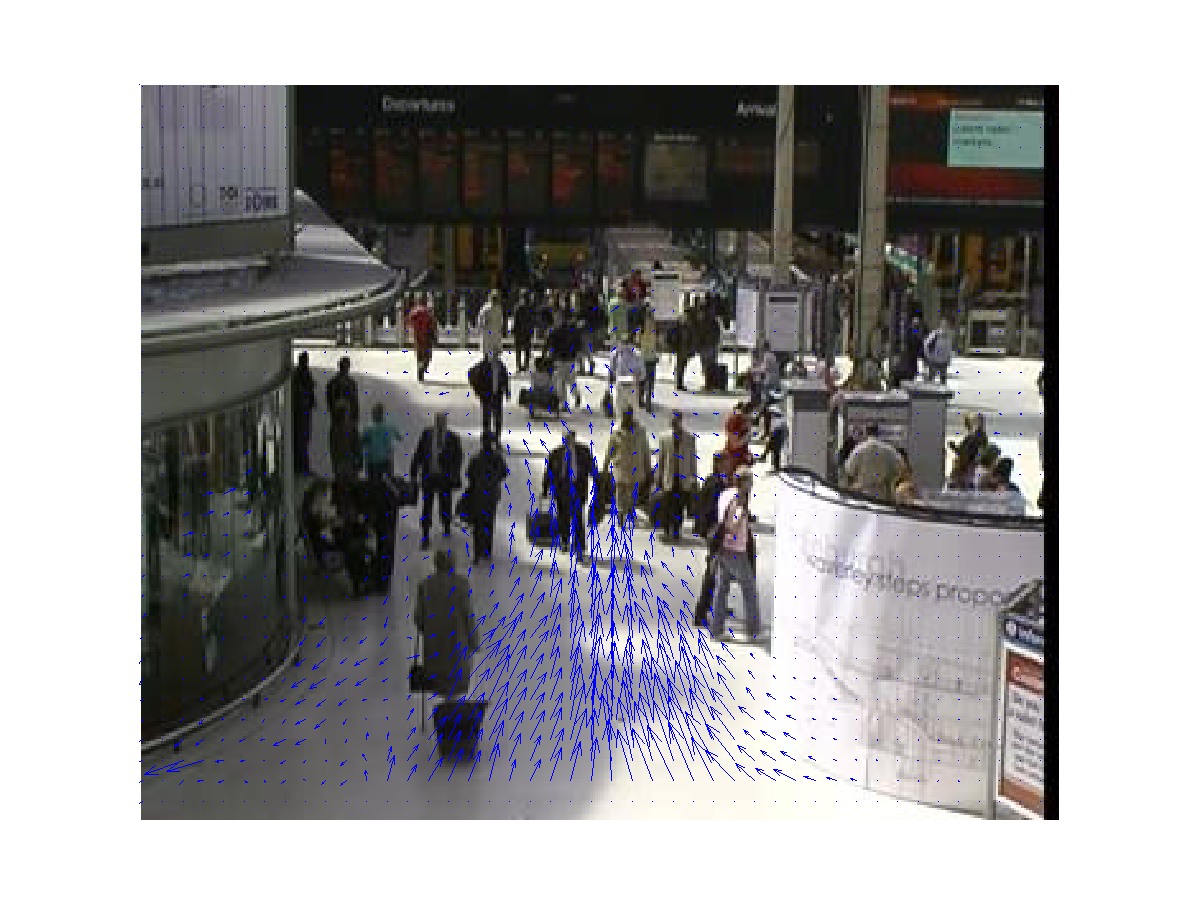
The picture below shows an example of the simulation visual output. Left, main paths entrace and exit points in the ground plane for the simulation, centre rendering of the scene in the image plane, and right optical flow result (arrows indicate direction and light areas larger displacement).
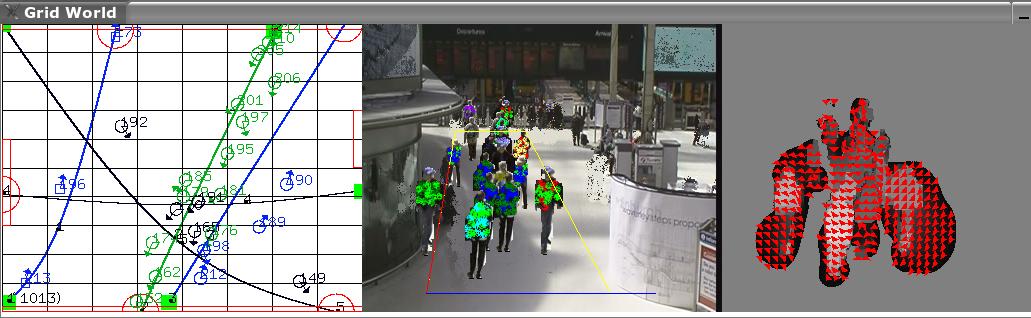
The following movie illustrates the emergency event at frame 2000: crowd.avi (there are some people being 'generated' close to the exit which just 'peek' at the scene. The ground plane limits are the lines drawn on the image plane this is where people 'appears' and disappears' on the screen. The block occurs at the image bottom (blue line) for exits 2 and 5 the other flows are unaffected.
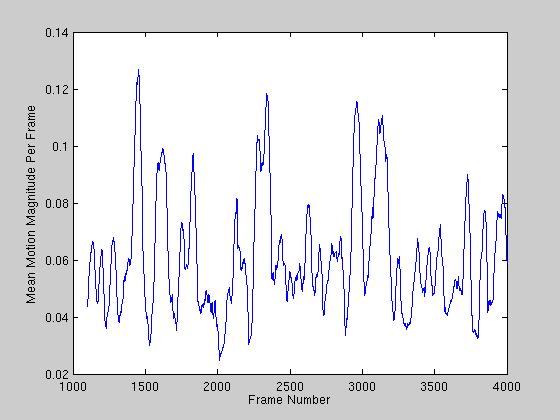
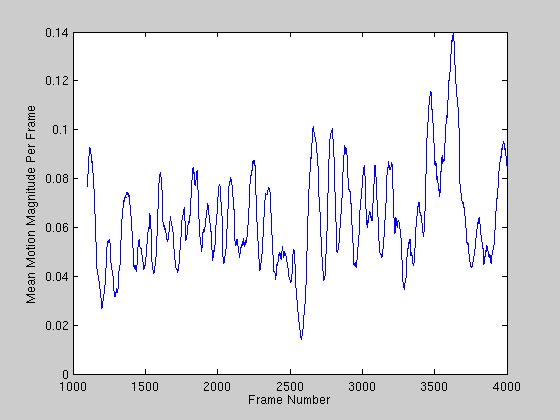
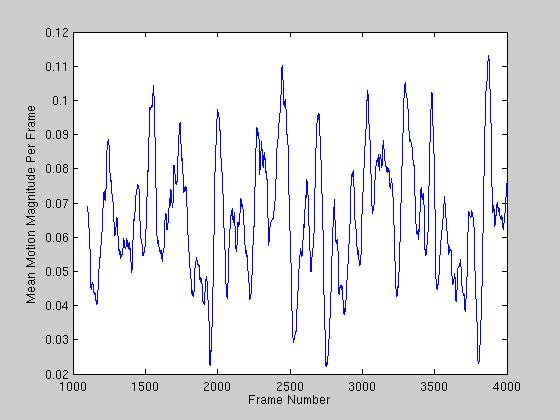
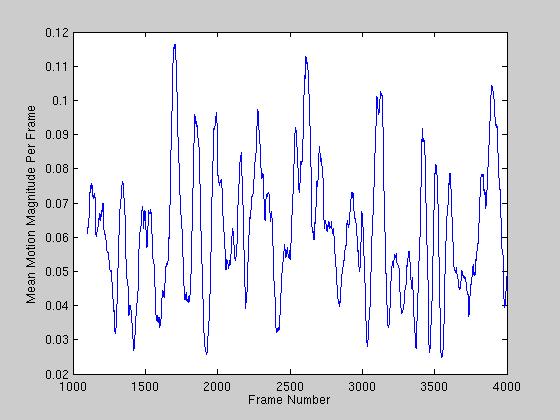
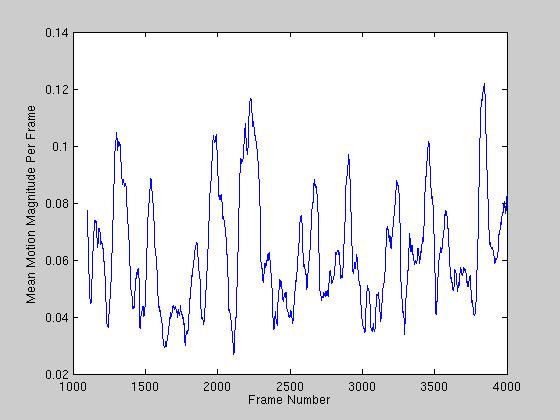
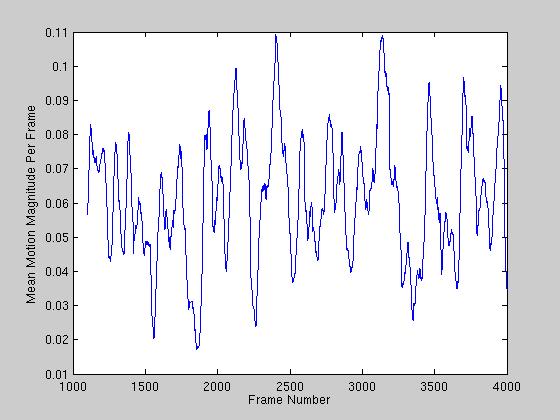
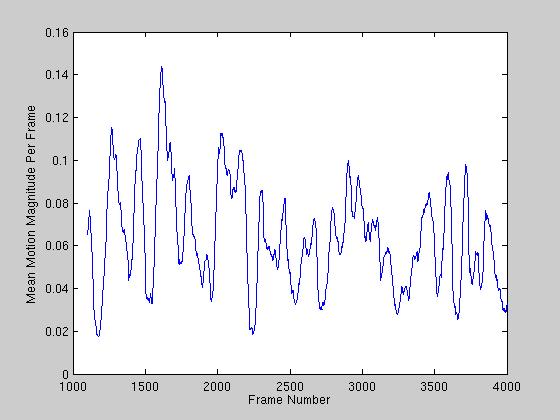
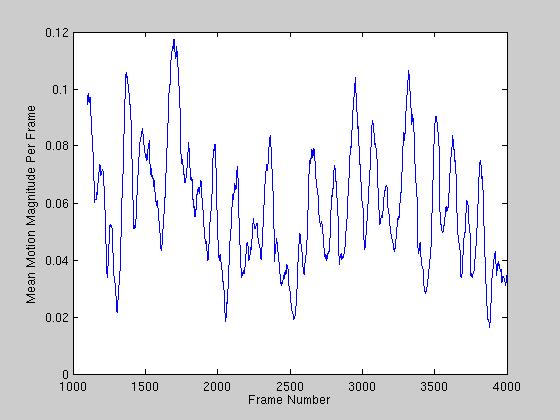
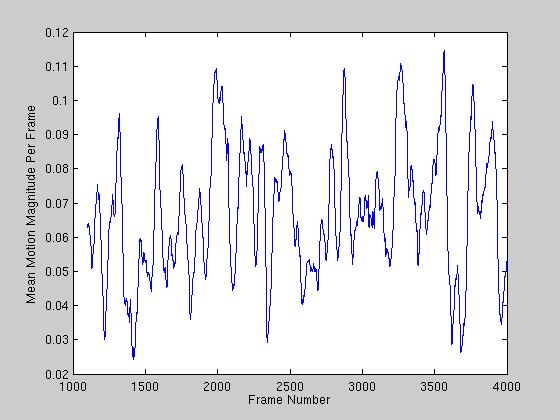
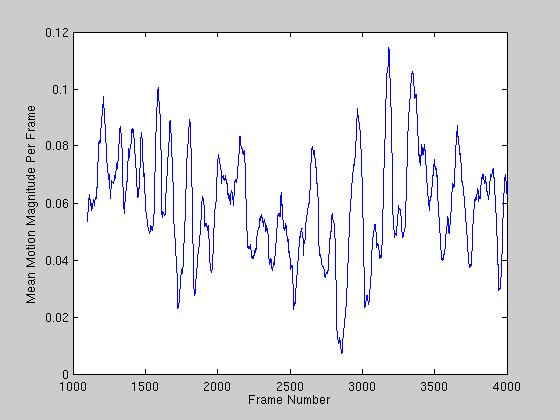
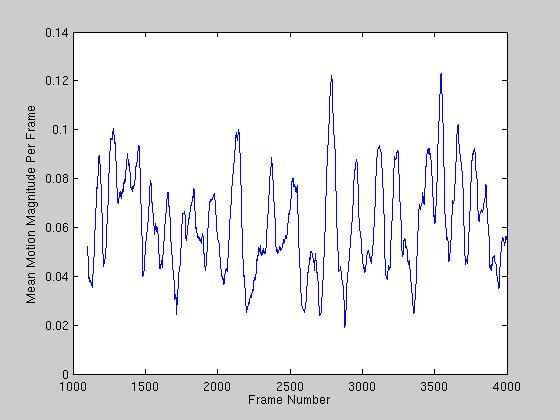
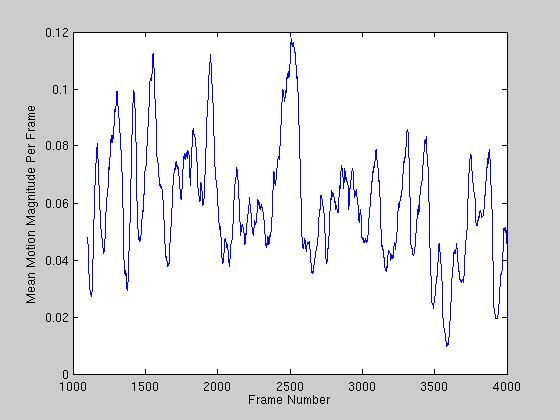
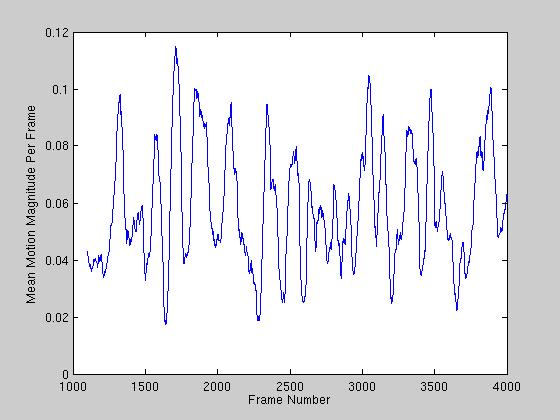
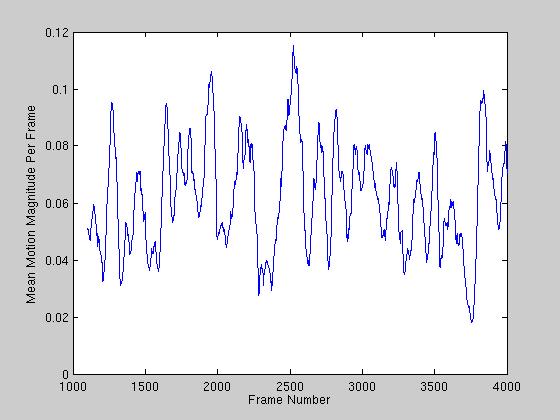
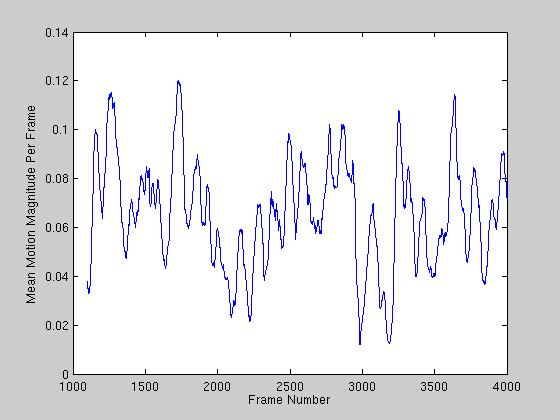
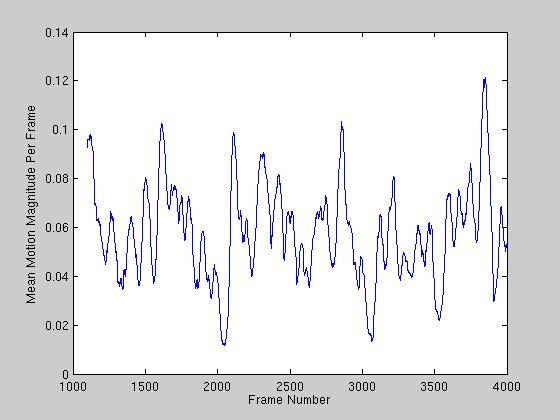
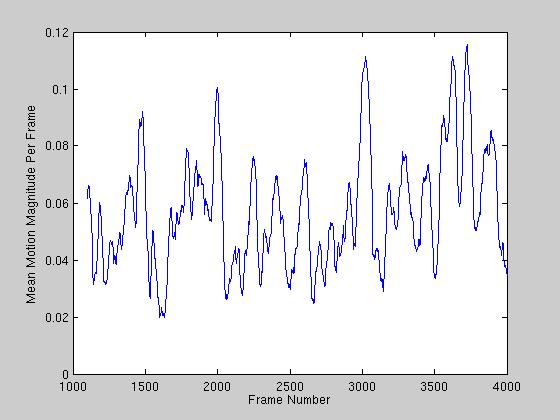
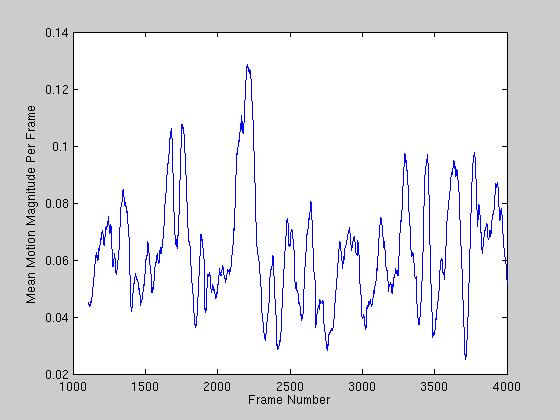
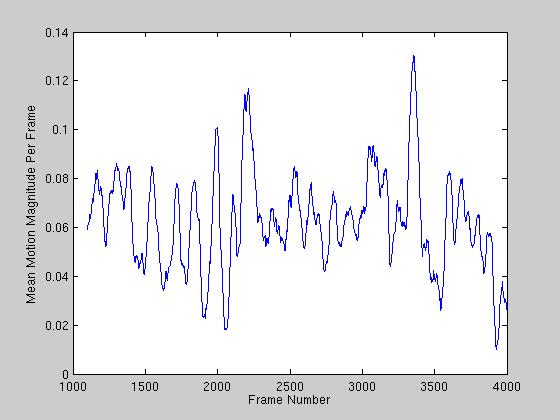
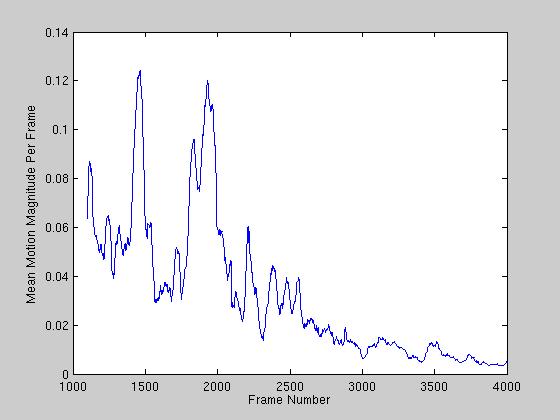
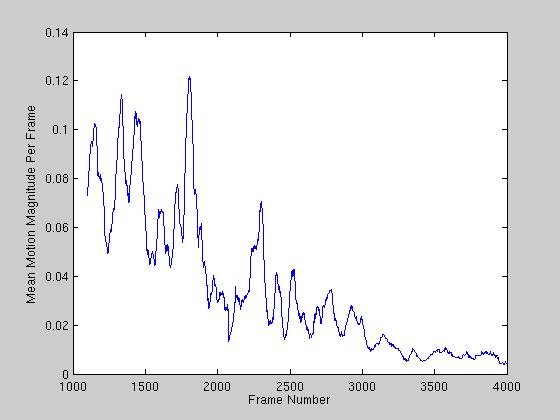
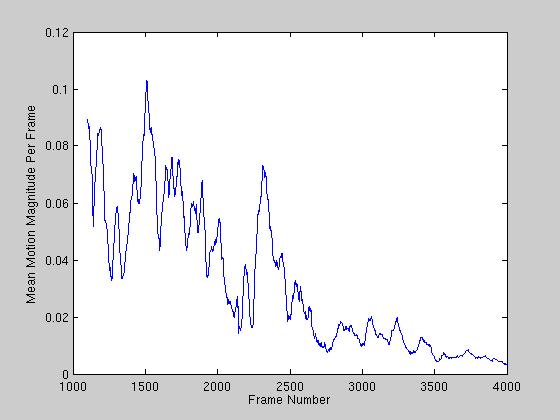
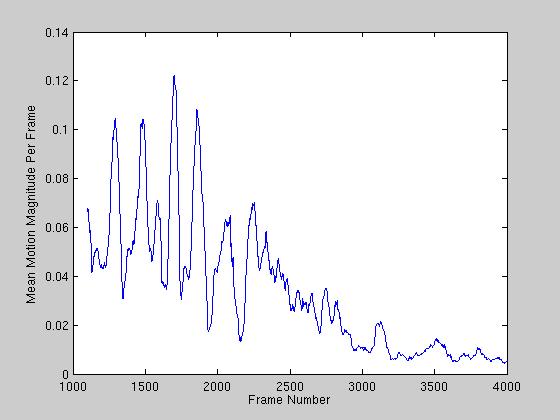
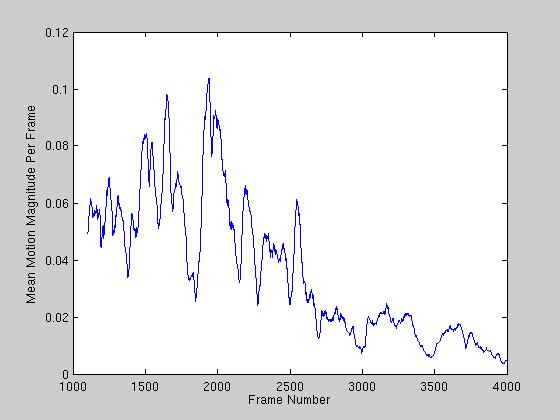
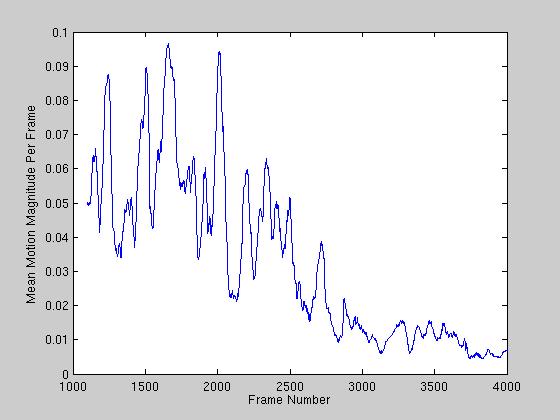
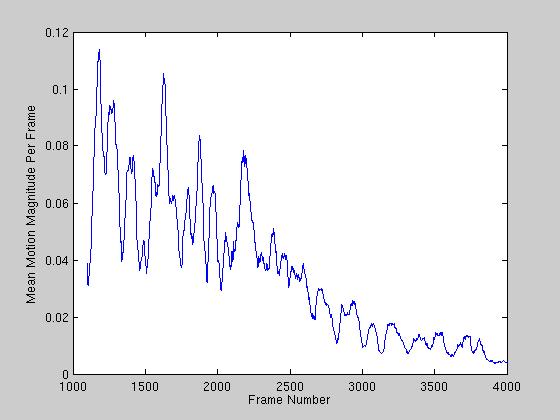
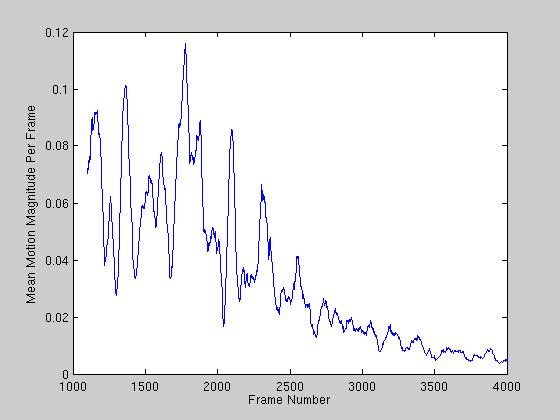
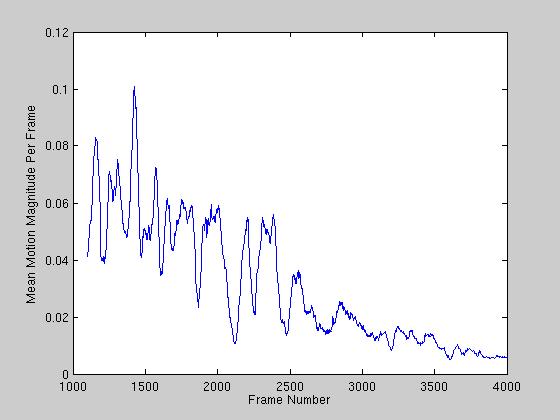
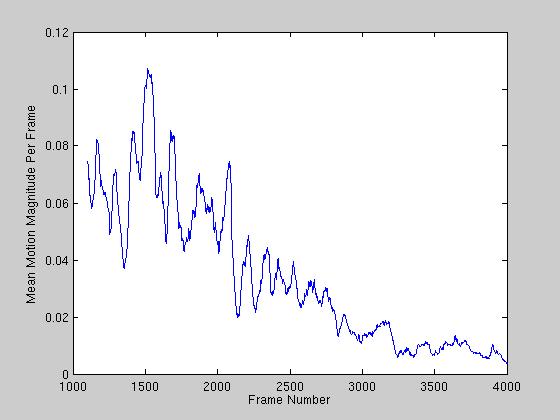
To illustrate the dissimilarity among the simulated sequences here is a summary of the motion content of each sequence through time. The measure in based on the mean motion magnitude per frame and comparing the graphs we can note the effect of the different random starting points in the simulation.
normal_1 normal_2 normal_3 normal_4 normal_5 normal_6 normal_7 normal_8 normal_9 normal_10
normal_11 normal_12 normal_13 normal_14 normal_15 normal_16 normal_17 normal_18 normal_19 normal_20
block_1 block_2 block_3 block_4 block_5 block_6 block_7 block_8 block_9 block_10
Results
The following graphs illustrate the results for the eigenanalysis (eigenflows of the first eigenvector):
Simulation: the normal files were sample to get from frame 2500 to 3600 of each sequence (600x10 frames) to compute the eigenbasis for the simulation data. (Matlab memory constraints).
Real Data: all the 5000 frames of station_002 were used to compute the eigenbasis used to project the real data.
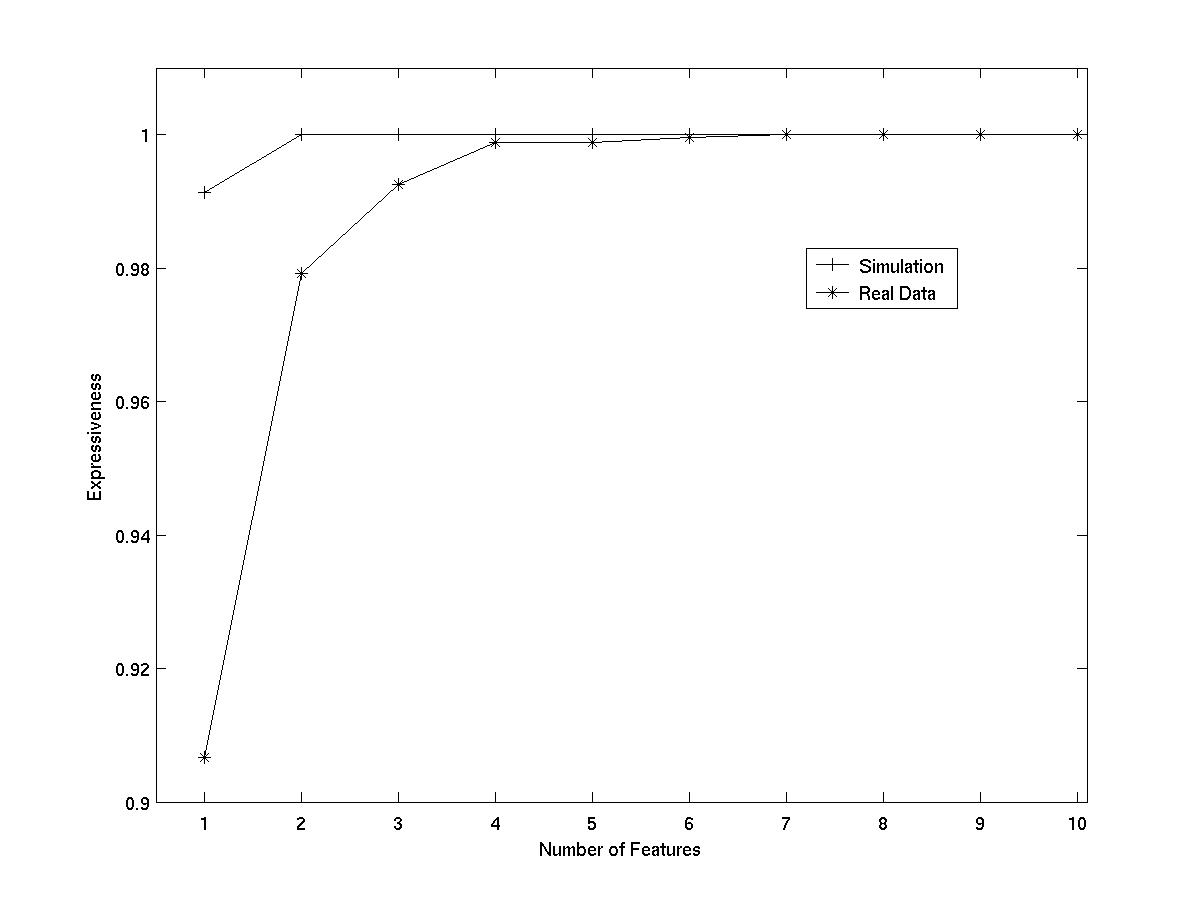
Expressiveness: the results for our 'expressiveness' definition of the information of the model. The general tendency is the more eigenvectors we add the more the samples in the test set are within one standard deviation of the gaussian model definide for the samples in the traning set. The formal definition of expressiveness is the percentage of test points that lie within one standard deviation of the distribution of training points. We did try 3*sigma before but it was too large and encompassed all the simulated data (this is by construction) and around 2 evs. covered all the test set samples for the real scene.
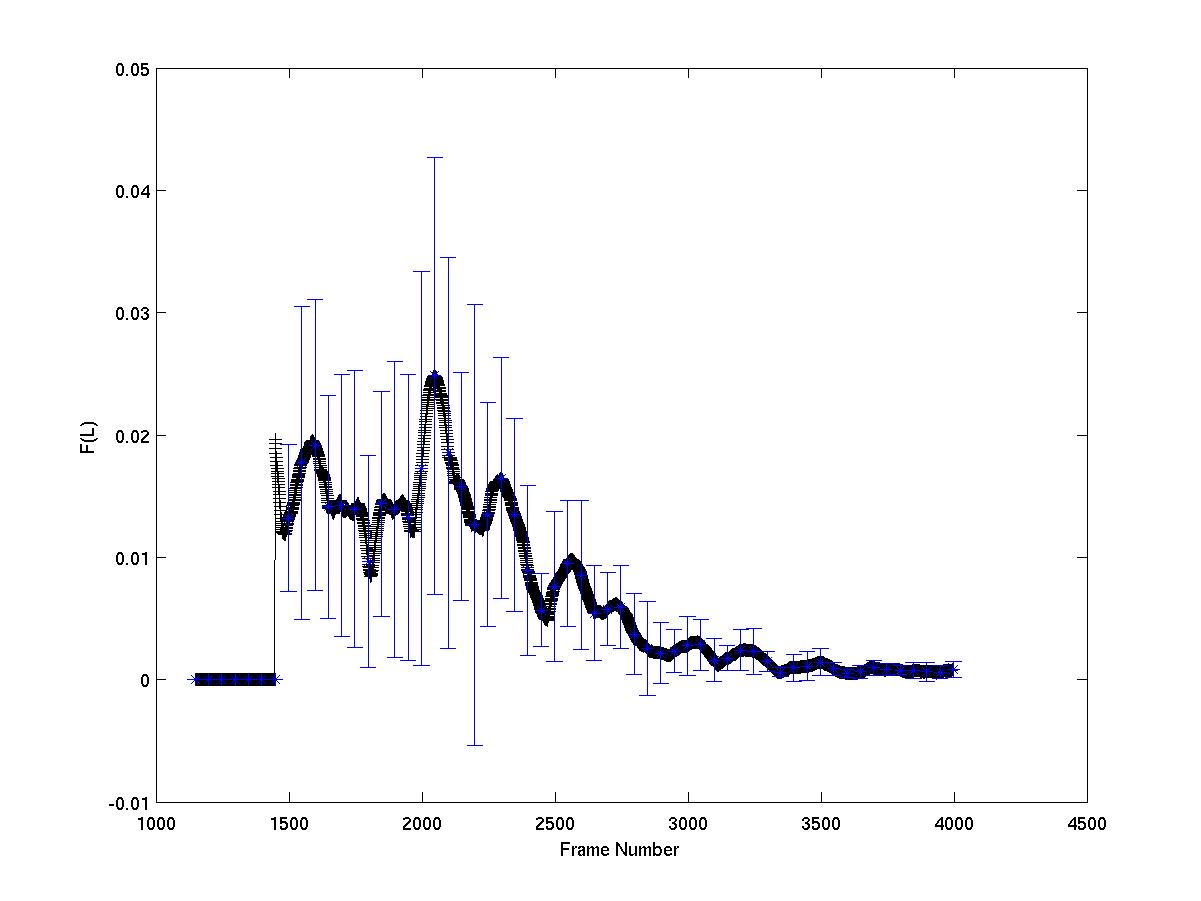
Simulated Crowd Blockage Behaviour: This is not the best possible model fit but illustrate the possible results with a good fit. The main reason is that the variability in the simulated pattern is high and I have to explore more the parameter space to see if the model will be able to cope with that.
Normals: number of frames declared blocked
Blocked: number of frames declared blocked, lag time to declaration (48 frames lag with 150 frames delay W=300)
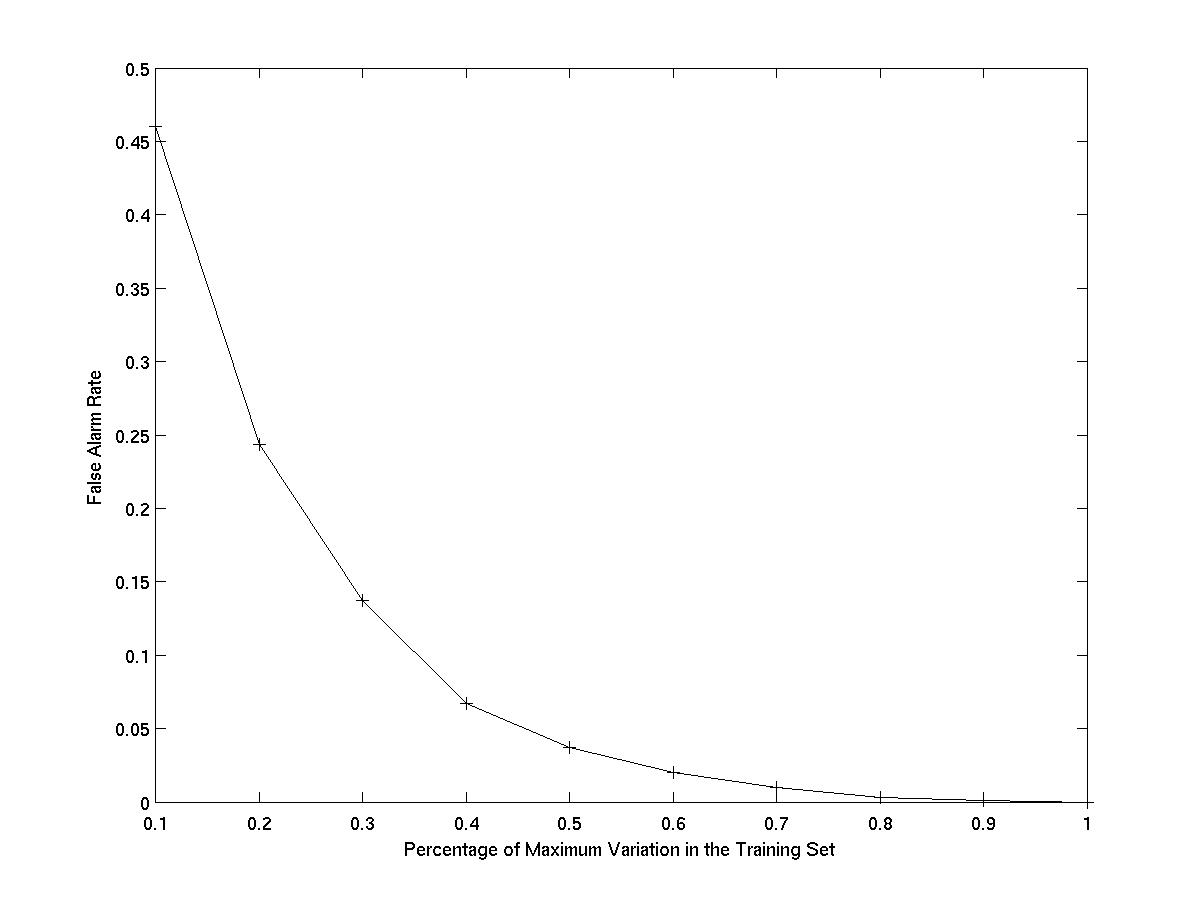
Real Crowd Normal Behaviour: number of false detections. We evaluated the number of false detections against a threshold which is based in a factor of the maximum variation present in the trainig set. We applied our 'edge filter' to the likelihood function with a window (delay) of 100 frames (4s) to give the detection results. False alarm rate (false alarms / 15000 frames - 3 test sequences).
Synthetic data
The following 3 datasets show crowd scenes eith 2 entry and one exit point using sprites in 3 situations: