See The Pipeline for a description of the logical structure of the geoparser pipeline, and how to customise it if required. This chapter explains the physical layout of the software directories and provides flowcharts of the run script that drives the pipeline.
The directory structure is as shown in Figure File layout. The scripts directory contains all the driving scripts, with run being the master that will run the entire pipeline. The Flowcharts diagrams show how the subsidiary scripts slot in; these in turn call routines from the lib directory libraries.
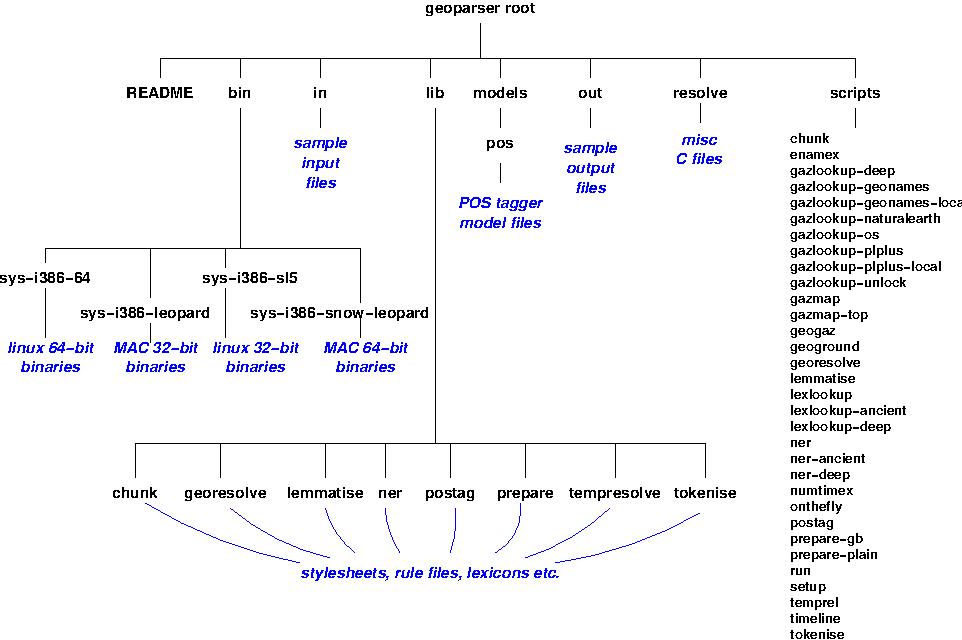
File layout
There is a setup script called by all other scripts to check the platform and set paths correctly. This checks for an environment variable $LXDEBUG which, if set, puts the pipeline into debug mode, so that intermediate temporary files (in /tmp) are kept for examination instead of being cleaned up when the pipeline exits.
This section contains two flowcharts, for the geotagging and geoparsing steps, explaining the physical structure of the software. These may be handy for reference if you are planning to customise the geoparser. They cover the run script that drives the pipeline and calls other scripts in the scripts directory.
The pipeline is designed to be modular so that you can slot in your own components if desired. These flowcharts show the input and output required at each stage. The command line options tested in the decision diamonds are explained in Section Running the Pipeline.
The first chart, Figure Geotagging flowchart, shows the first stage of the peipeline, up to the production of geotagged text output, ie a file with linguistic markup (paragraphs, sentences, tokens, part of speech tags, lemmas) and with Named Entities identified and categorised. The pipeline annotates the input with more than just geographic entities. Personal names, organisations and time expressions are also tagged, along with event relations that can be plotted on a timeline.
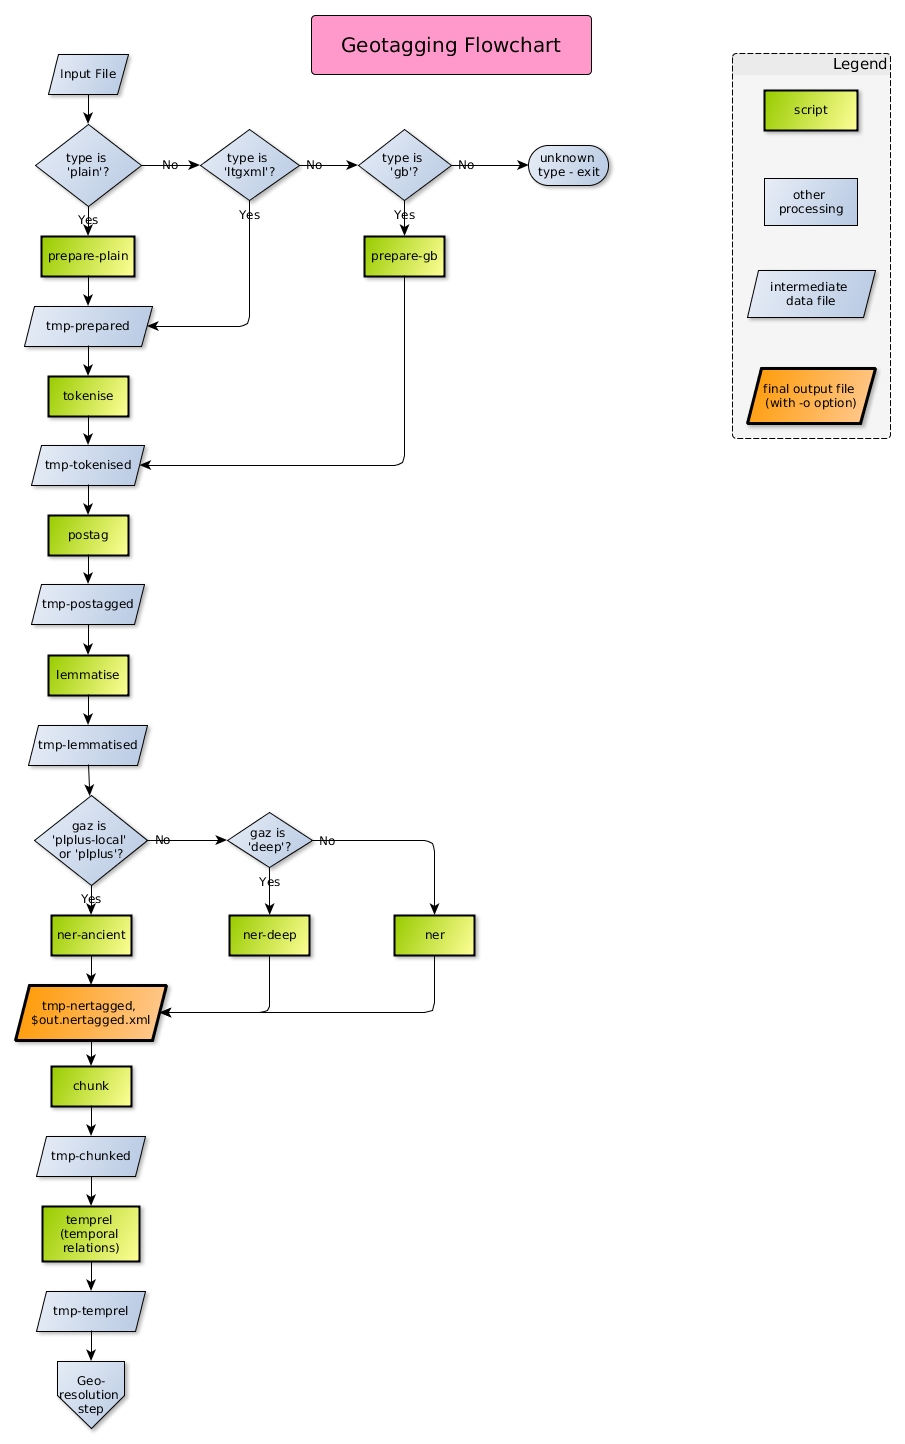
Geotagging flowchart
The second chart, Figure Georesolution flowchart, covers the second stage, taking the output from step one as input. The pathway will depend on the parameters specified to the run command. Without the -o option, specifying output files destination, the visualisation steps are skipped altogether and the geogrounded textual output goes to standard out. If -o is specified then various display files are created, primarily for mapping (using Google Maps), but including event detection displayed with a Timeline widget and highlighting other entity categories besides location.
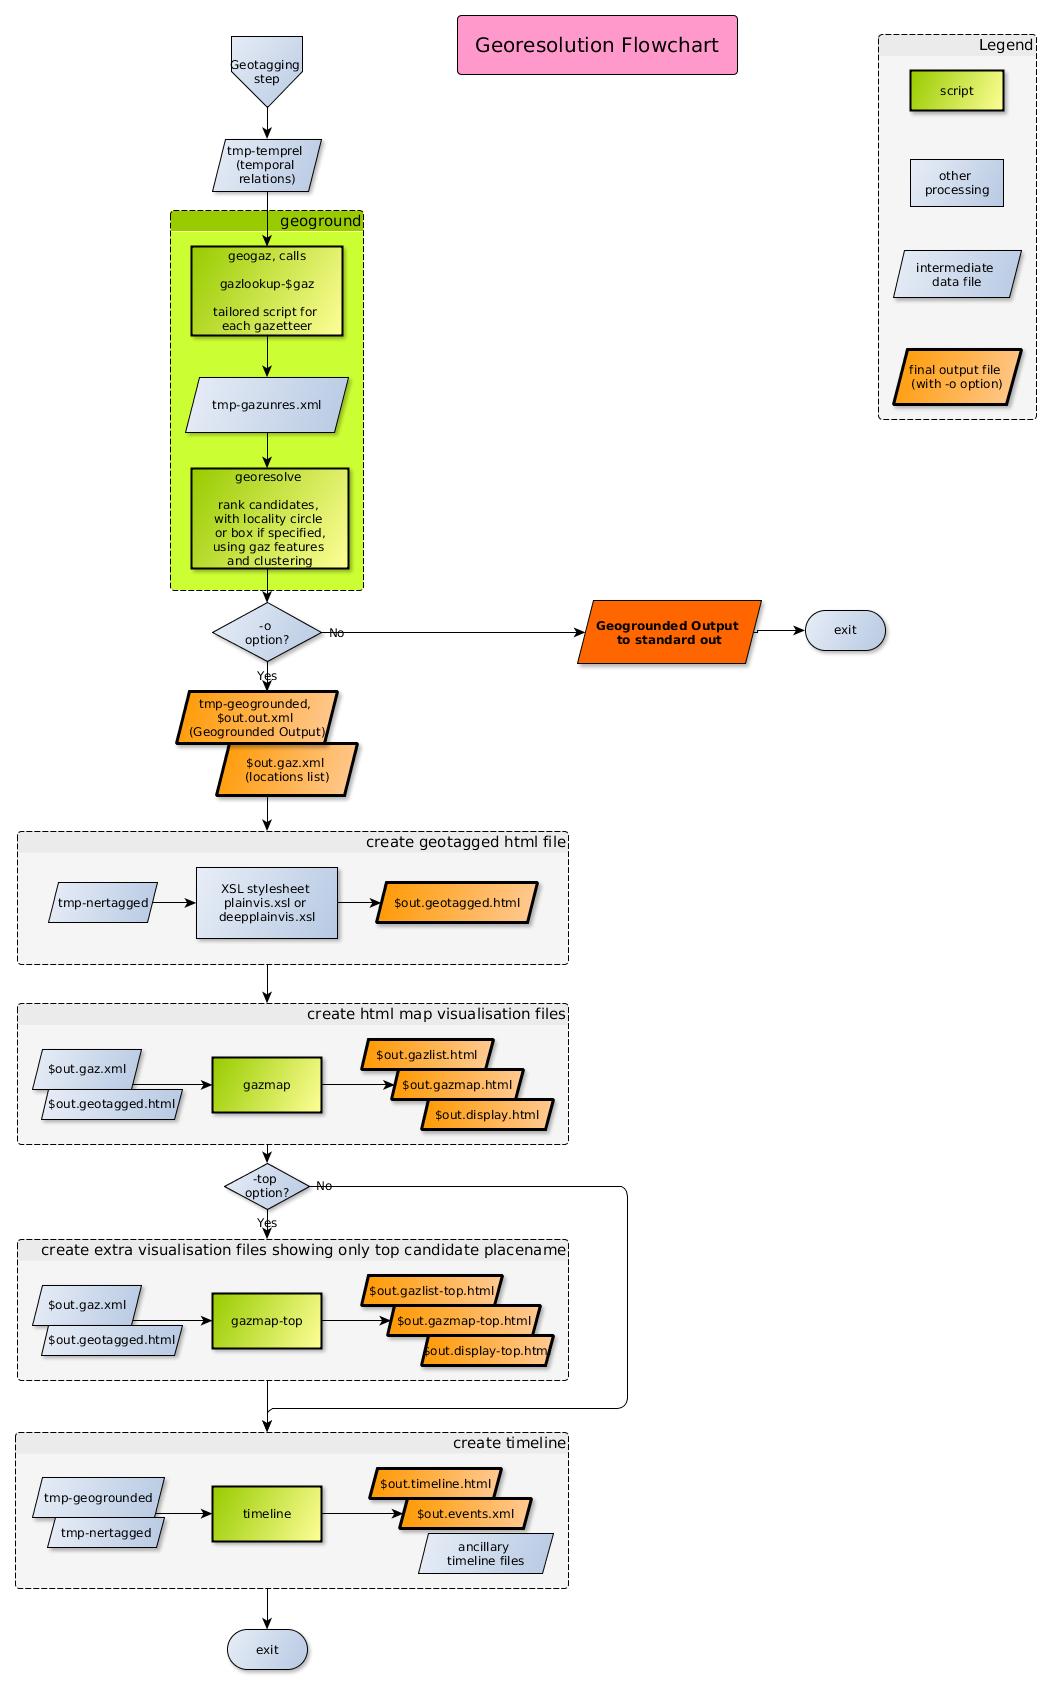
Georesolution flowchart